The San Francisco Bay Area is in the midst of a housing crisis. San Francisco, San Jose, and Oakland are respectively the first, third, and fifth most expensive rental markets in the country, according to the most recent Zumper National Rent Report. Job growth, particularly in the tech sector, is pushing up the demand for housing all over the region. Though home builders are responding with new residential projects across the region, supply is falling short of demand.
To try to address that shortage, the Terner Center for Housing Innovation at the University of California, Berkeley, launched a set of online calculators called the Housing Development Dashboard, aimed at helping to identify the most effective combinations of policies that can get more housing built.
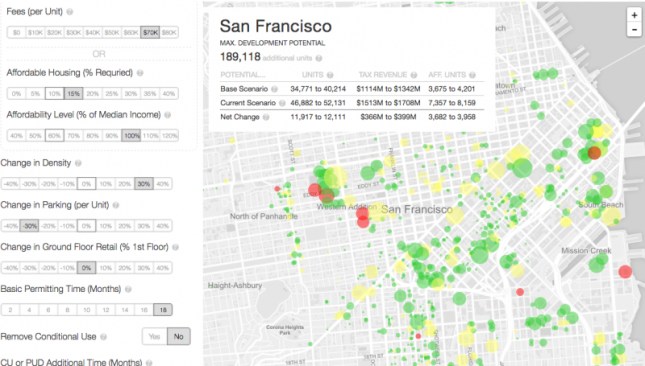
The dashboard’s Development Calculator estimates the probability of a project being built, given the local land-use policies and economic conditions, as well as variables like construction costs, rents, and desired return on investment. The Policy Gauge shows how changes to policies and zoning rules can impact housing production in four Bay Area cities: San Francisco, Oakland, Pleasanton, and Menlo Park. The Terner Center developed these calculators with Graham Macdonald, a recent graduate of UC Berkeley’s Goldman School of Public Policy, using multiple sets of development-related data in conjunction with the housing and land-use policies of those four cities.
Courtesy Terner Center for Housing Innovation

Courtesy Terner Center for Housing Innovation
Terner Center director Carol Galante says decision makers don’t have easy access to this kind of information right now “without spending a million dollars on a feasibility study on what would happen if they increased their impact fees by X percent.”
Developers and architects will also find the dashboard useful. Galante says it can be a good early assessment tool to get a broad picture of what type of development is likely to happen and where new opportunities for building may arise.
“If you’re an architect and you’re thinking about ‘What am I designing to and what kind of budget do I need to be meeting in order to produce a product that’s actually going to get built,’ you can do some high-level calculations to get to the probability that what you’re designing can happen,” she says.
In addition to identifying effective policies to maximize housing in a given place, the dashboard also shows how different policies affect different places. Reducing parking requirements in Oakland, for example, would likely increase the probability of new housing being developed because the cost of construction goes down and the rate of return goes up. In San Francisco, where parking requirements are already relatively low, bringing them down even further wouldn’t have as big an impact in encouraging developers to build.
“The Development Calculator is a great indicator for what would happen if supportive legislation and local planning policy changes were enacted, such as a reduction in fees to encourage affordable housing development,” says Irving Gonzales, AIA, principal of the San Francisco–based firm G7A, which specializes in housing and community-oriented architecture. But he also suggests some tweaks, like the ability to calculate for projects with more than 40 percent affordable housing and to expand to other cities. “It would be curious if the tool would reflect any development impacts for not only locating housing near transit centers, but also what would happen if transit in general were greatly improved,” he says.
Galante says the tool is still in beta mode, and going forward, she hopes to grow the dashboard’s reach beyond the Bay Area. “Other metro regions in the state of California, and frankly other metro regions outside the state of California, are under similar kinds of pressures,” she says. “You don’t necessarily need this tool everywhere in the United States, but there are other markets, Seattle or Denver as examples, where this type of tool could be useful.”